Over the past year, I found myself constantly questioning which segment of the market performed the best. Large caps? Midcaps? Or something else entirely? To satisfy my curiosity, I created a table analyzing the performance of major Indian indices over multiple timeframes.
Breaking Down the Performance 📊
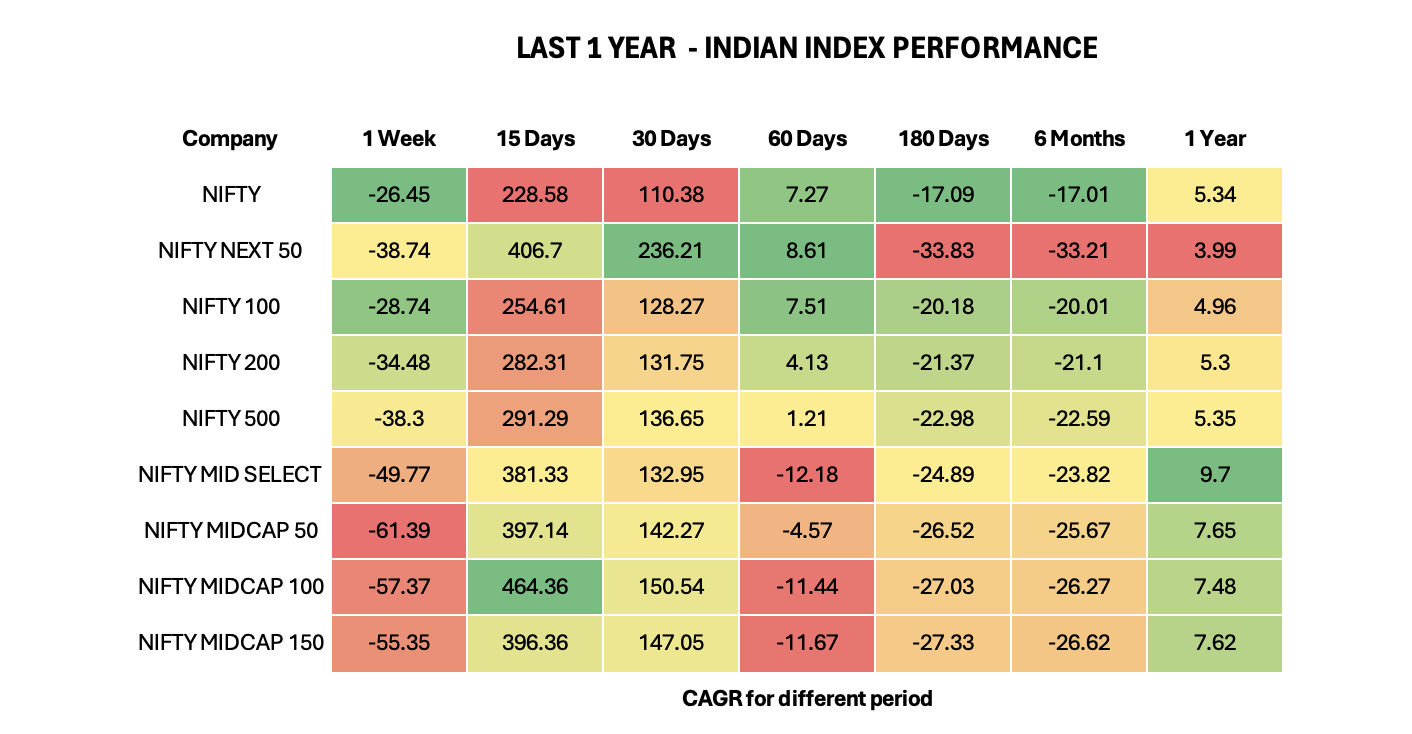
For this analysis, I considered key indices:
- NIFTY, NIFTY 100, 200, and 500
- NIFTY NEXT 50
- Midcap indices: NIFTY MID SELECT, MIDCAP 50, 100, and 150
By tracking their CAGR across 1 Week, 15 Days, 30 Days, 60 Days, 180 Days, 6 Months, and 1 Year, I aimed to spot trends and volatility patterns.
What I Learned 🔍
- Midcaps are highly volatile – They experienced massive short-term fluctuations, but their 1-year CAGR was consistently stronger than large caps.
- Large caps offer stability – While they didn’t have the highest returns, they also didn’t see the extreme dips that midcaps faced.
- Short-term spikes don’t always last – Some indices had explosive growth over 15-30 days but failed to maintain that trajectory for the full year.
Final Takeaway 🎯
Midcaps may feel like a thrilling ride, but if you can handle the volatility, they tend to deliver superior returns over time. However, patience and a strong risk appetite are key.
Volatility is the price you pay for growth.